Remote Sensing Course

ZD - Remote Sensing & Satellite Data

Remote sensing makes it possible to observe the Earth from a distance and systematically map changes. Satellites, aircraft, and drones are used to collect data on vegetation, water, soil, built-up areas, and the atmosphere, among other things. By analyzing this data, spatial patterns and trends can be identified that are difficult or impossible to observe from the ground. Remote sensing thus serves as an important source of information for a wide range of issues in areas such as water management, agriculture, nature conservation, climate, the environment, and urban development.

Course duration: 3 days
Dutch

Introduction to Remote Sensing

Geo-ICT Training Center, Nederland - Remote Sensing Basis

Remote sensing makes it possible to observe the Earth from a distance and systematically map changes. Sensors on satellites, airplanes, and drones collect data on vegetation, water, soil, built-up areas, and the atmosphere, among other things. By analyzing this data, spatial patterns and developments can be identified that are difficult or impossible to observe from the ground.

In this course, you’ll learn how satellite and other image data are used to observe, analyze, and monitor the Earth’s surface. You’ll work with QGIS and various types of remote sensing data and learn which image characteristics determine what information you can extract from them.

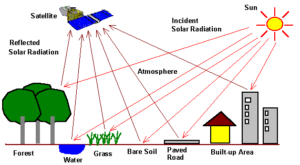
An important component is understanding the relationship between electromagnetic radiation, sensors, and the Earth’s surface. Different materials, such as water, vegetation, soil, and built-up areas, reflect and absorb radiation in different ways. By analyzing these differences, objects and conditions on the Earth’s surface can be identified and studied.

The course also covers the analysis of changes over space and time. By comparing images taken at different times, for example, changes in vegetation, land use, water, and urban areas can be visualized.

The Basic Remote Sensing Course thus combines the fundamental principles of remote sensing with practical Geo-ICT skills. QGIS is used throughout the course as a tool for working with real remote-sensing data, visualizing images, and performing analyses.

If you are not yet familiar with QGIS, we recommend that you take the 3-day QGIS Basics course.

Earth Observation and the Role of Geo-ICT

Remote sensing begins with observing the Earth from the air or space. Sensors record characteristics of the Earth’s surface and the atmosphere and convert these observations into digital data. Depending on the sensor, different parts of the electromagnetic spectrum can be observed.

Using GIS, these observations can be combined with other geographic data. Satellite imagery, aerial photographs, and drone imagery can be linked in QGIS to, for example, elevation data, land use, soil data, water data, and administrative boundaries.

During the course, you will learn not only to view this data as images but also to use it for spatial analyses. This provides insight into patterns and changes on the Earth’s surface, and remote-sensing data can be used to investigate geographic issues.

Fundamentals of Remote Sensing

A solid foundation in remote sensing begins with an understanding of how sensors collect information about the Earth’s surface. We’ll examine electromagnetic radiation, reflection, absorption, and the spectral properties of various materials.

You’ll learn the differences between various sensors and observation platforms, as well as how spatial, spectral, and temporal resolution influence what you can observe in an image. This will help you understand why one image source is suitable for a particular problem while another is not.

We’ll put these principles into practice using QGIS. You’ll learn, step by step, how to view, combine, and analyze remote sensing data, and how to translate the information from images into usable geographic information.

What will you learn in the Basic Remote Sensing Course?

Integrating and analyzing remote sensing data with QGIS

Remote sensing involves working with various types of image data, such as satellite imagery, aerial photographs, drone imagery, and multispectral data. During the course, you’ll learn how to import, visualize, combine, and analyze this data in QGIS.

You’ll work with real and open datasets as much as possible. This will not only teach you how to work with image data but also give you insight into the data available for studying and monitoring the Earth.

By combining different spectral bands and geographic datasets, characteristics of the Earth’s surface can be revealed. This forms the basis for further analyses and for answering specific geographic questions.

Performing Remote Sensing Analyses with QGIS

An important practical component of the course involves analyzing and interpreting remote sensing images. You will learn how to identify different land surfaces in images and how to use spectral information to distinguish between, for example, vegetation, water, soil, and built-up areas.

Images and other geographic data are then combined to investigate specific questions. How healthy is the vegetation? Where is water located? How is land use changing? Which areas are urbanized? And what changes are visible when images from different time periods are compared?

By the end of the course, you’ll combine various data sets and analyses in a hands-on remote sensing case study. In doing so, you’ll not only learn how to use QGIS but, more importantly, how to apply remote sensing and Geo-ICT to identify, analyze, and assess patterns and changes on Earth.

Why Choose Our Basic Remote Sensing Course?

The Basic Remote Sensing Course offers a broad introduction to Earth observation, directly linking theory and practice. You’ll learn how information about the Earth is collected from satellites and other observation platforms and apply this knowledge immediately using image data and QGIS.

  • Broad foundation in Remote Sensing: you’ll be introduced to Earth observation, sensors, electromagnetic radiation, spectral bands, and various types of image data.
  • Practical approach: You’ll work hands-on with QGIS and perform analyses on real, open-access remote sensing data.
  • Geo-ICT as a tool: You’ll learn to combine image data with other geographic datasets to investigate patterns and changes on the Earth’s surface.
  • From Image to Information: You’ll learn not only how to interpret satellite images but, more importantly, how to derive useful information from them to address specific geographic issues.
  • Foundation for further study: After this course, you can delve deeper into topics such as satellite data, multispectral analysis, vegetation monitoring, radar, thermal remote sensing, and change detection.

By the end of the course, you will have a broad foundation in remote sensing and Geo-ICT and will understand how satellite and other image data can be used with QGIS to observe the Earth, analyze spatial patterns, and investigate changes over time.

Read more

Enroll

€1695,-
  • Workload: 3 Course days from 9:00 AM to 4:00 PM
  • Location: Apeldoorn or Online. On-site is also possible. Please get in touch for a quotation.
  • Date: Multiple start dates are available; please see the registration page.
Register for this course

Daily Schedule

Day 1 – Observing the Earth with Remote Sensing

The first day focuses on understanding remote sensing and how satellites, aircraft, and drones collect information about the Earth. You’ll be introduced to various observation platforms and sensors and learn what types of information can be observed using them.

We’ll cover the basics of the electromagnetic spectrum and examine how water, vegetation, soil, and built-up areas reflect and absorb radiation. You’ll learn why these differences are important and how they are reflected in remote-sensing images.

We’ll also cover the key characteristics of image data. You’ll learn what spatial, spectral, temporal, and radiometric resolution mean and why they are crucial for selecting an appropriate data source.

You’ll then get hands-on experience working in QGIS. You’ll learn how to open, view, and interpret satellite images, and you’ll work with individual spectral bands, natural colors, and various band combinations. By the end of the day, you’ll understand how a remote-sensing image is created and what information you can identify within it.

Β 

Day 2 – Analyzing Image Data and Deriving Information

The second day is devoted to the actual analysis of remote-sensing data. You’ll go beyond simply viewing satellite images and explore how spectral properties can be used to derive information about the Earth’s surface.

You’ll analyze differences between vegetation, water, soil, and built-up areas, and learn how different spectral bands and band combinations reveal these differences. You’ll also be introduced to spectral indices that can be used to enhance and examine specific characteristics in images, such as the condition of vegetation or the presence of water.

In QGIS, you’ll perform various analyses yourself and combine remote-sensing images with other geographic data. This will teach you how satellite data becomes part of a broader Geo-ICT analysis.

Throughout the day, the focus remains on the geographic issue at hand. What information do you need? What image data is suitable for that purpose? What analysis will you perform? And what do the results actually tell you about the area you’re studying?

Day 3 – Investigating Changes and Applying Remote Sensing

On the third day, the knowledge and skills acquired during the first two days are brought together. The focus is on investigating changes in space and time and applying remote sensing to specific real-world problems.

You’ll compare images taken at different times and investigate changes in vegetation, water, land use, or urban development, for example. In doing so, you’ll learn to critically assess whether a visible difference actually represents a change on the Earth’s surface or is caused, for instance, by season, cloud cover, imaging conditions, or differences between sensors.

You will then combine remote sensing data with other geographic data in QGIS. This will demonstrate how remote sensing and GIS complement each other and how satellite imagery, when combined with elevation, soil, water, or land-use data, provides a more complete picture of an area.

The course concludes with a hands-on remote sensing case study. Starting with a specific geographic problem, you’ll determine what data is needed, select and analyze the image data in QGIS, combine various information sources, and interpret the results. In doing so, you’ll go through the entire process from Earth observation to analysis and ultimately to usable geographic information.

Course duration: 3 dagen
Sign me up

Learning Objectives

  • Understanding the Remote Sensing Process: You will understand how observations from satellites, aircraft, and drones are collected and how this data is processed into usable geographic information.
  • Selecting Appropriate Image Data: You can assess, based on a geographic problem, which sensor, image source, and resolution are appropriate, and you understand the importance of spatial, spectral, temporal, and radiometric resolution.
  • Interpreting Remote Sensing Images: You can read and interpret satellite and other image data and recognize how vegetation, water, soil, and built-up areas respond differently within the electromagnetic spectrum.
  • Analyzing remote sensing data with QGIS: You can use various spectral bands and band combinations and perform analyses to derive information about the Earth’s surface from image data.
  • Investigating changes in space and time: You can compare images from different points in time to identify and analyze changes in, for example, vegetation, water, land use, and urban development.
  • Combining remote sensing and GIS: You can combine image data with other geographic data to investigate spatial patterns and relationships and build a more complete picture of an area.
  • Applying remote sensing to real-world problems: Based on a specific geographic issue, you can determine which data and analyses are needed and translate the results into actionable information for areas such as water management, agriculture, nature conservation, the environment, and urban development.

Want to know more?

Do you have questions about the course content? Or are you unsure whether the course aligns with your learning goals or preferences? Would you prefer an in-house or private course? We’d be happy to help.

Frequently Asked Questions About Remote Sensing

Satellite images contain much more information than what is visible to the human eye. By using different parts of the electromagnetic spectrum, it is possible, for example, to distinguish between vegetation, water, soil, and built-up areas. During the course, you will learn how to recognize, analyze, and interpret this information.

That depends, among other things, on the spatial, spectral, temporal, and radiometric resolution of the available imagery. For example, the type of imagery needed to study vegetation may differ from that required for water, land use, or urban development. You will learn to assess these characteristics and relate them to the research question you wish to explore.

By comparing images from different points in time, you can identify changes in, for example, vegetation, water, land use, and buildings. In doing so, you’ll also learn to assess whether differences are actually changes or are caused, for example, by the season, cloud cover, or varying imaging conditions.

Remote-sensing images are often combined with other geographic data, such as elevation, soil, water, and land-use data. During the course, you’ll use QGIS to integrate and analyze this data. This provides a more complete picture of an area and allows satellite images to be translated into useful information for specific geographic issues.

The course is offered both in person and online. The course runs from 9:00 a.m. to 4:00 p.m. Coffee, tea, lunch, and a laptop are provided for in-person participants.