• Searching...

Result 73 - 83 of 83 courses

R GGPlot

R
  • Certified
  • Workload: 24 hour

R Spatial

R
  • Certified
  • Workload: 24 hour

Satellite Data with SNAP

Earth Observation
  • Certified
  • Workload: 24 hour

Smart Maps with Python and Leaflet

Python
  • Certified
  • Workload: 24 hour

Spectral Thermal Imaging

Data Analysis
  • Certified
  • Workload: 24 hour

SQL Basics

Databases
  • Certified
  • Workload: 24 hour

UAV Mapping Basics

Geodesy
  • Certified
  • Workload: 24 hour

Urban Applications of GIS and Python

Spatial Planning
  • Certified
  • Workload: 24 hour

Using GDAL

Earth Observation

Web Scraping Water Levels in Python

Python
  • Certified
  • Workload: 24 hour

WebODM

Drones
  • Certified
  • Workload: 24 hour
1 5 6 7

Why choose a course at Geo-ICT Training Center, The Netherlands?

55

Courses

82

Blended Learnings

1200

Participants per year

What is Blended Learning?

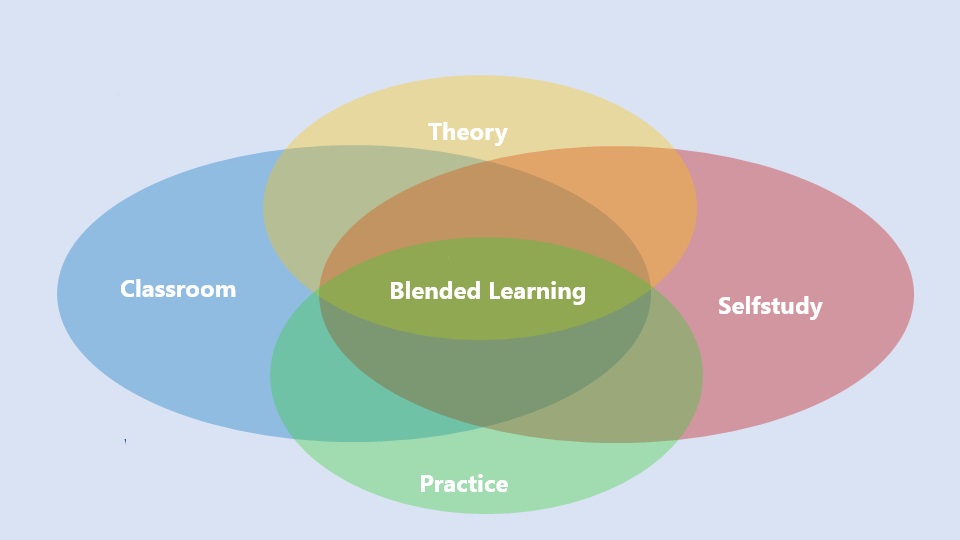
Blended Learning is an educational approach that combines live, face-to-face online instruction with digital learning experiences. This approach integrates the strengths of both live virtual and self-paced digital environments to create a flexible, personalized learning experience for students.

Key components of Blended Learning include:

  1. Face-to-face instruction: Traditional teaching methods like lectures, discussions, and in-class activities.
  2. Online learning: Digital content delivered through video lessons, interactive modules, and online discussions.
  3. Student control: Learners have the flexibility to control the time, pace, path, or place of their learning through online components.

Blended learning is increasingly popular as it leverages technology to provide more individualized instruction, support diverse learning styles, and combine synchronous (real-time) with asynchronous (self-paced) experiences.

A Venn diagram with four overlapping ovals labeled "Classroom" (blue, left), "Selfstudy" (red, right), "Theory" (yellow, top), and "Practice" (green, bottom). At the center, where all four areas overlap, is "Blended Learning" shown in green. The image illustrates that blended learning is a combination of theory, practice, classroom instruction, and self-study.

In our R Ggplot course you will learn advanced data analysis and visualization with the R programming language and the GGplot2 package, ideal for both beginners and experienced professionals in data analysis.

Yes, our course is designed to support both beginners and advanced programming enthusiasts, with a focus on practical applications and clear explanations.

The course lasts two days and provides intensive training in R and GGplot. For information about the costs, please contact info@geo-ict.com.

Yes, after successful completion of the course you will receive a certificate of participation, recognized by the Dutch Council for Training and Education (NRTO).

For information about online participation and available dates, please contact info@geo-ict.com.

This course is ideal for anyone interested in data analysis and visualization, from beginners to experienced data analysts looking to expand their skills with R and GGPlot.

The course covers a wide range of topics including R basics, creating different types of graphs such as line and bar charts, advanced graphing techniques, and manipulating datasets with dplyr and reshape2.

You can enroll directly via the registration widget or by contacting info@geo-ict.com. We offer both in person and online course options.

Yes, the course includes practical exercises and examples with large data sets to directly apply the skills learned.

Knowledge of R and GGPlot is highly valuable in many industries for data analysis and visualization, which can significantly improve your career prospects.